Purpose
View a graphical representation of data in a grid list.
Where to find
Click >> then Chart in the toolbar on a browse window, lookup list and detail edit window.
1. Group the records in the grid list to identify the Series that will be charted.
For example, group Work Orders by Asset and Staff Code.
The first series is the Count of the total number of records in the grid list.
2. Click >> then Chart.
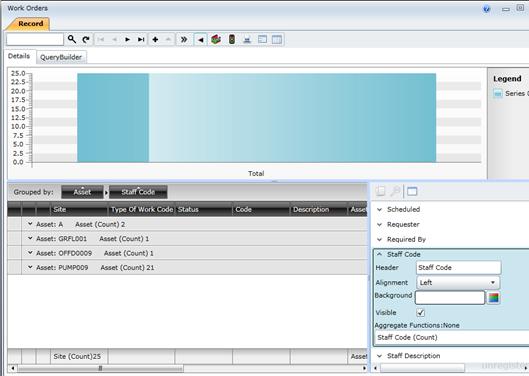
3. Open column properties for the grid list (drag the blue bar and marker on the right of the frame towards the left).
4. For each column name that is grouped in the grid, click on the column name in the column properties, select an Aggregate Function, click in the Aggregate Function box then click ![]() to add the Aggregate Function to the chart.
to add the Aggregate Function to the chart.
The chart is displayed above the grid list.
The “No Aggregate Functions are defined for the chart” message is displayed if the grid list has not been grouped.
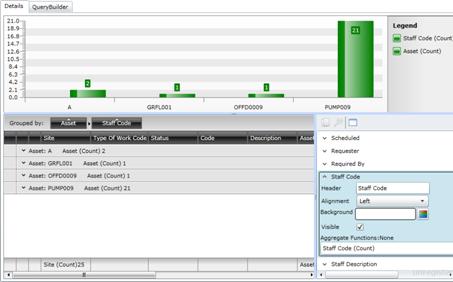
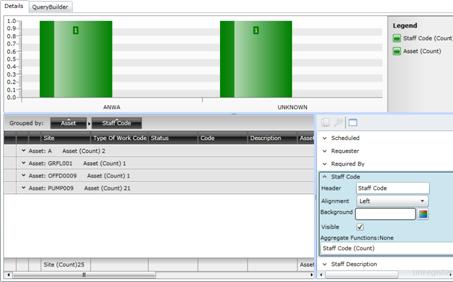
5. Click a bar to view the lower level of detail.
6. Repeat for each group.
7. Click ![]() to return to the previous level of detail.
to return to the previous level of detail.
Please note!
What can I do?
These non-standard tools are available for the chart (on the left of the grey bar).
|
Click… |
To… |
|
|
Return to a higher level series in the grouping hierarchy. |
|
Work Orders for Site 11 are grouped by Asset Code and Staff Code, and a “Count” Aggregate Function has been specified for Asset Code and Staff Code in chart properties. The first chart reflects the total Count (24) and appears as follows: Click on the bar chart to drill down to the next series for Asset Codes and Staff Codes: Click on the bar chart for Asset “A” to drill down to the series for Staff Codes:
|