
 |
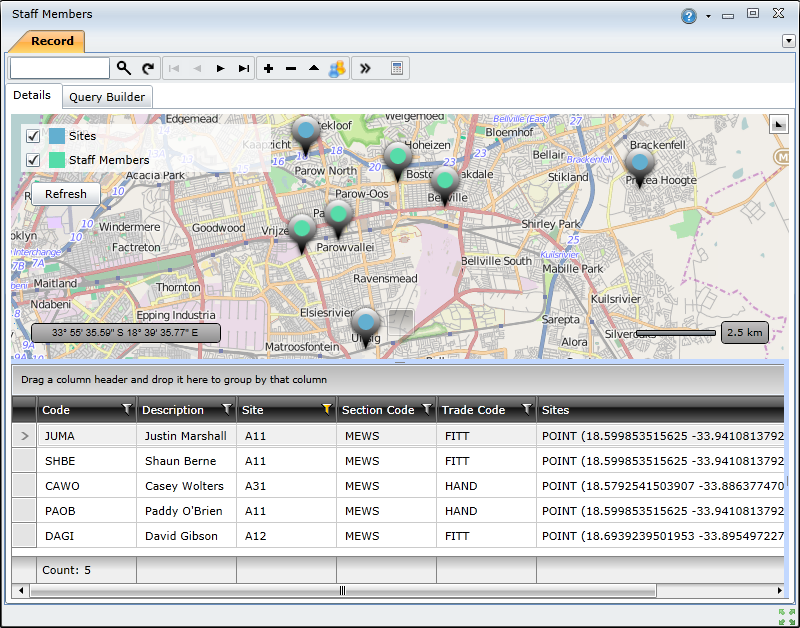
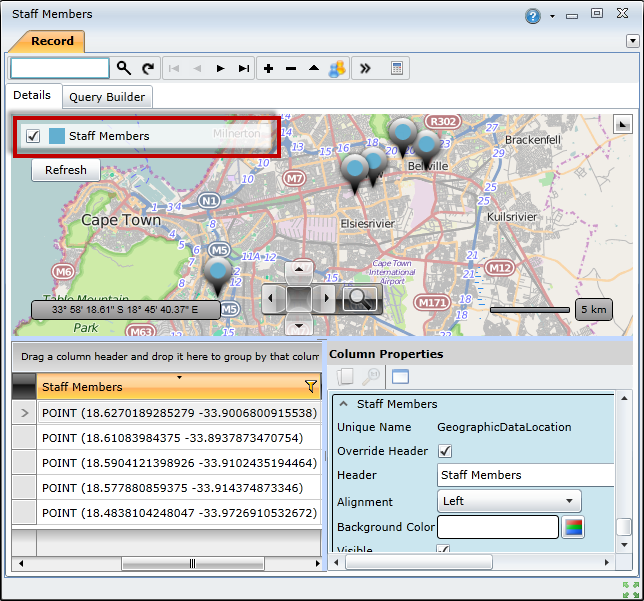
The Map functionality enables you to view the geographic locations for items included in a browse window grid. This functionality is only available for browse windows that list business objects that support geographic data, such as assets, work orders, staff members, locations, and sites. The image below shows a Staff Member browse window that shows the locations of staff members and their sites.
In order to use the Map functionality, you need to do the following:
How to ... Enable the Map in the Browse Window
Enabling the map will make it appear above the grid in the browse window. To enable the map for a specific browse window, you need to do the following:
Open the browse window.
Click the Additional Options ( ) and select Map.
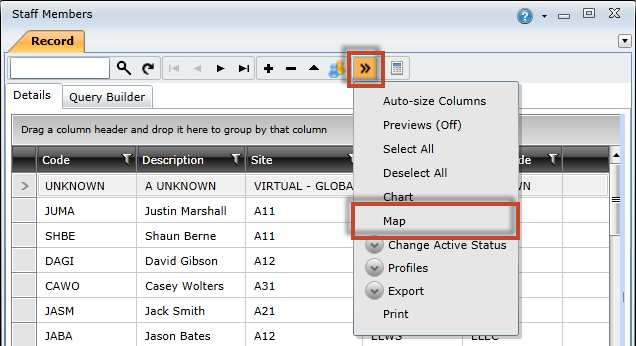
NOTE: Location markers will only be displayed after the required fields have been added to the grid. View the next section to learn how to add the required fields to the grid.
How to ... Add the Required Fields to the Grid
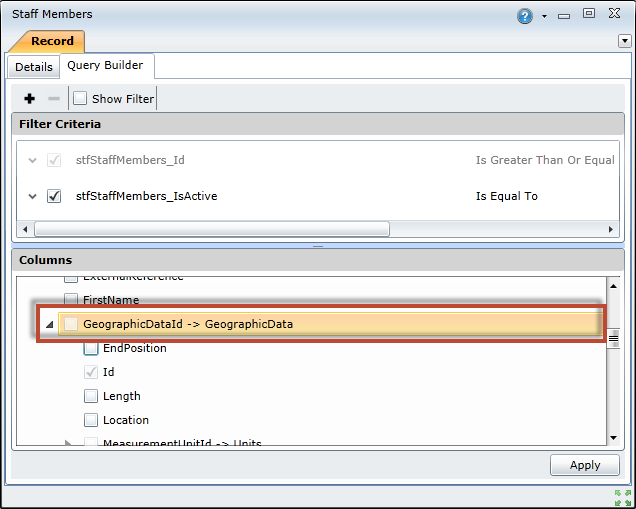
In order for the grid items to be displayed on the map, their location fields must be added to the grid using the Query Builder. To add a location field to the grid, you need to do the following:
Click the Query Builder tab.

Expand the GeographicDataId -> GeographicData column.
Select the check box next to the Location field.
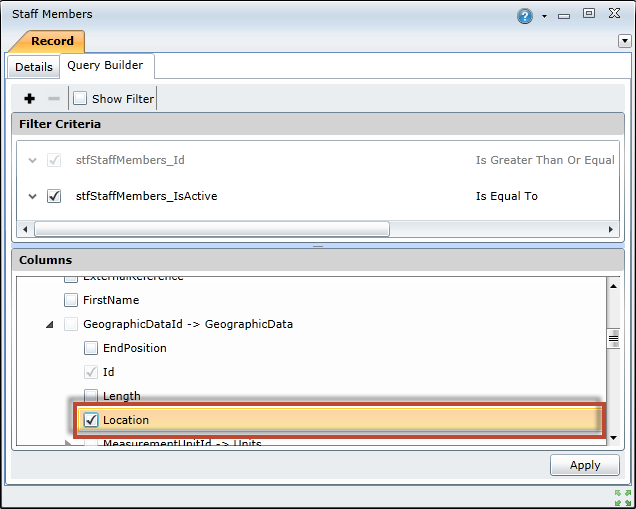
Click the Apply button.
Click the Refresh ( ) button to refresh the browse window.
Some browse window maps can be configured to display multiple types of location markers. For example, the map for the Work Order browse window can be configured to display work orders, along with their assets, responsible staff members, and sites. These additional fields can be added by selecting the appropriate location fields in the Query Builder.
Visit the Using Query topic to learn more about using the Query Builder.
How to ... Customise the Location Markers Rollover Text
Rollover text appears when you move the mouse cursor over a location marker on the map. This text helps you to identify the specific business object (ie grid item) that the marker represents. The image below shows the location marker and rollover text for a staff member.
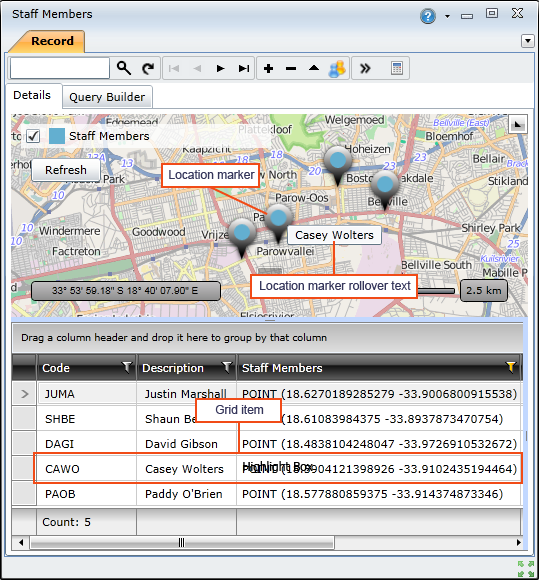
You can customise the rollover text used by the location markers on the map. By default, the rollover text will be the text contained in the cell immediately to the left of the Geographic Data Location column in the grid.
Example: For the grid below, the rollover text will be the staff members' last names. If you move the mouse cursor over Jack Smith's location marker on the map, 'Smith' will be displayed as its rollover text. If however, you want to use the Staff Code as the rollover text, you need to move the Geographic Data Location column so that it appears to the right of the Staff Code column (ie between the Staff Code and First Name columns).
| Staff Code | First Name | Last Name | Geographic Data Location |
| JUMA | Justin | Marshall | 18.62701 -33.900688 |
| JASM | Jack | Smith | 18.37841 -33.922337 |
| MASA | Matt | Saunders | 19.61064 -83.900245 |
To change the rollover text for the location markers, you need to do the following:
Locate the Geographic Data Location column in the grid.
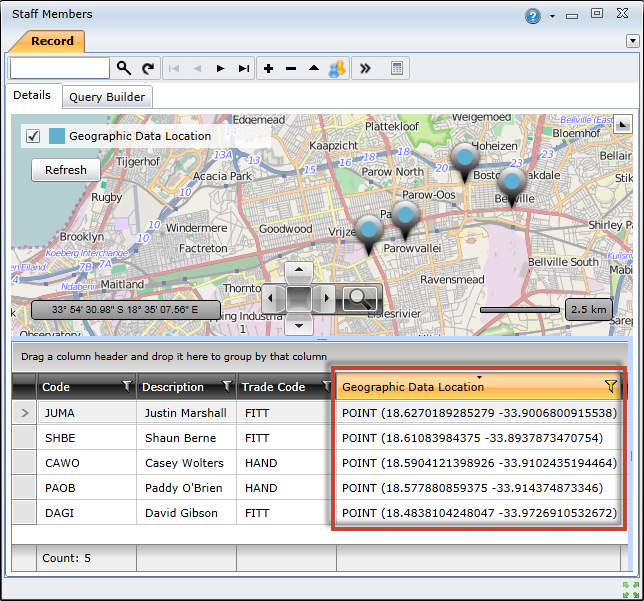
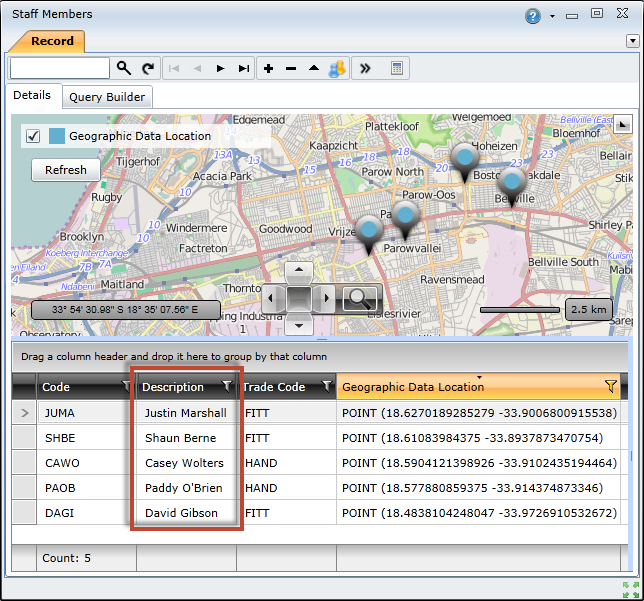
Identify the column that contains the information that you want to use as the rollover text.
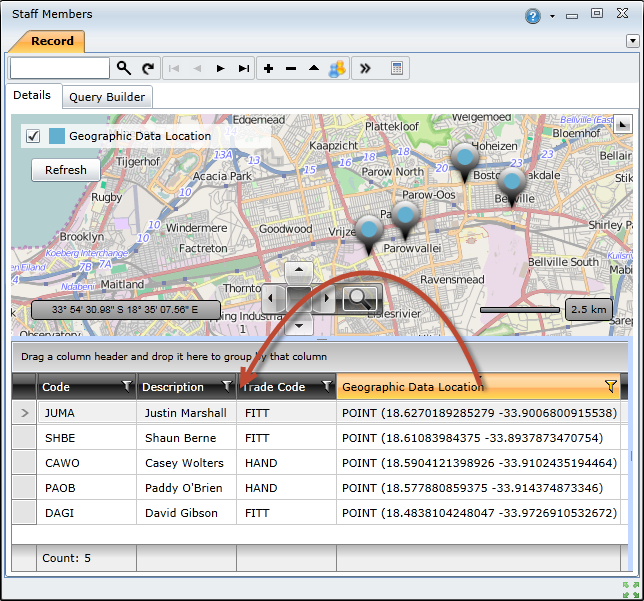
Drag the Geographic Data Location column and drop it to the right of the column identified in the previous step.
Click the Refresh ( ) button to refresh the browse window.
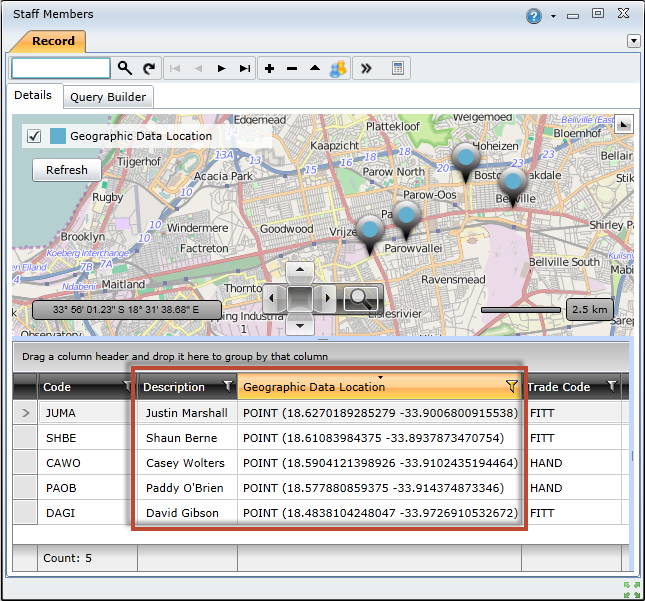
View the Repositioning Columns topic to learn more.
How to ... Customise the Map Legend
Each type of object represented on a map is assigned a location marker with a unique colour. The map legend helps to distinguish between the different types of location markers, and it correlates the location marker colours with the grid data they represent.
For example, the map for a Work Order browse window that lists 10 work orders can be configured to display the location of each work order, along with the location of its responsible staff member and linked asset. This means that the map would include 30 location markers (ie 10 work orders + 10 staff members + 10 assets). In this case, all 10 work orders will be displayed in blue, all 10 staff members will be displayed in green, and all 10 assets will be displayed in yellow. The legend for this map would look like this:
| Work Orders | |
| Staff members | |
| Assets |
This legend would make it easy to distinguish between work orders, staff members, and assets on the map.
NOTES: The descriptions used in the legend will be based on the Geographic Data column names.
The marker colours are assigned automatically. However, you can customise the descriptions used to identify the different colours in legend. To do this, you need to do the following:
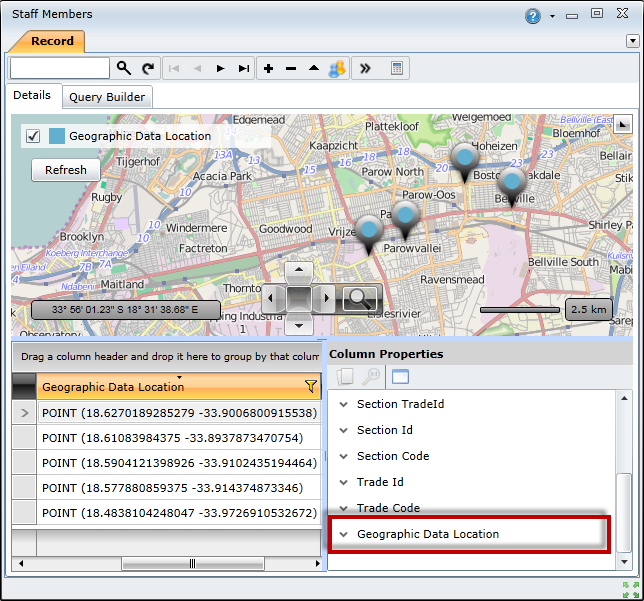
Open the Column Properties panel.
Click the Expand ( ) button next to the Geographic Data Location column
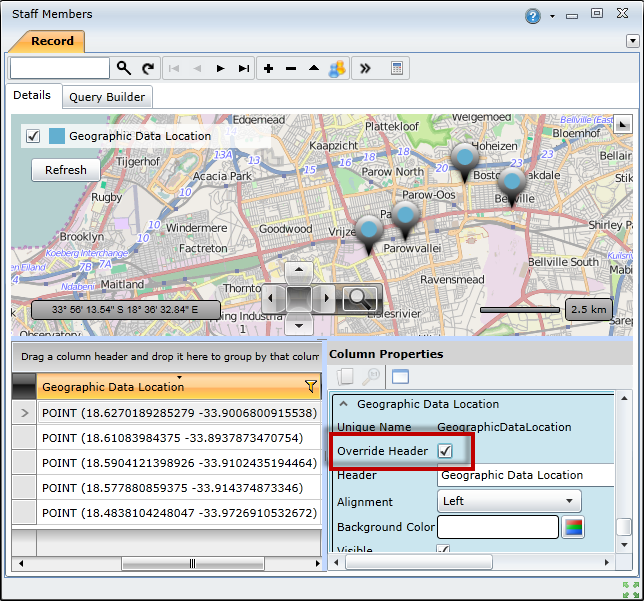
Select the Override Header check box.
Type the new column name in the Header text box.
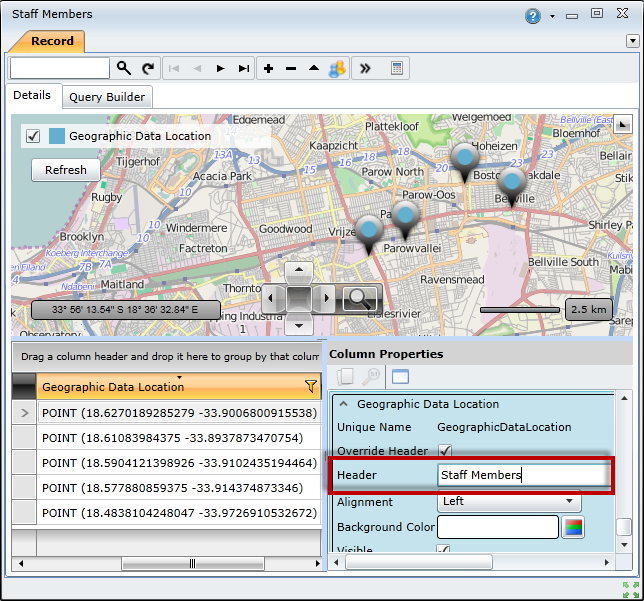
Click the Refresh ( ) button to refresh the grid and legend.
Visit the Setting Column Properties topic to learn more.